We’ve all heard the saying, “Those who cannot remember the past are condemned to repeat it.”
Crash Proof Your Investment is for both the stock market history enthusiast and the beginner and intermediate stock market investor.
Discover the mistakes made during the worst periods in stock market history through the story of the most disastrous and the most recent crashes in America.
No crash history would be complete without covering the 2010 flash crash, the 2008 financial crisis, the dot-com bubble, Black Monday of 1987, and the Wall Street crash of 1929. This historical context will shed light on the causes and lasting effects of these crashes.
The author shares the results of savvy stock market analysis in the chapter “The Nine Warning Signs of a Stock Market Crash Every Stock Investor Should Know,” which is a perfect guide for putting the investor in a better position to predict the next stock market crash.
The investment book is brimming with great investment ideas to help you protect your investment and explores seven strategies to protect your investment in a bear market or even in a full-blown meltdown.Protecting your portfolio during a stock market crash improves your return over the long run.
Topics in the context of protection, such as dividend stocks, stop-loss orders, options trading, and many more are discussed in detail.
Although options strategies are considered advanced topics in investing, the essential concepts of options for investment protection are simplified so that the beginner investor will readily grasp the protection strategy.
The information covered will be useful for long investors who want to protect their portfolio investment and investors who have been burned one too many times in stock market declines. But it is also for the short investor who would like to profit off the upcoming meltdown.
Mastering the market cycle is essential to becoming a good investor. Too often, investors focus on the uptrend or accumulation period of a market cycle but lack a plan for the downtrend or distribution period of the cycle.
Understanding a stock market crash is the knowledge that stock investors should gain if they want to play the stock market game effectively.
You must have stock market investment strategies that protect your portfolio by not reacting inappropriately to stock manipulations.
Remember the countless investors who got burned in the 2010 flash crash because their stop-loss orders were triggered? The market recovered in minutes, leaving these traders with huge, unnecessary losses—in some cases up to 60 percent. To avoid this issue, in this book, you willlearn how to protect your investment without stop-loss orders if you so choose not to use them.
Content is tailored in this investment guide to your specific situation by offering four optional exercises to apply to your portfolio investment as tools to help you invest more strategically in the future.
Continually improving yourself as an investor will move you closer to meeting your investment goals. Investment books like this increase your odds of becoming that millionaire stock investor who vacations in exotic locations around the world as your investments cover your expenses. (Or just retiring without worry if that’s your goal.)
Whatever your investment goals are, this book can help you get there. If this sounds interesting to you follow the link below to learn more:
Quite simply, I have figured out that there are only three types of stocks. It’s not Earth-shattering, and when I tell you what the types are, you might say—Duh!
Even though it is a simple concept, the trading strategies will be different for each type. If you are going to use a trading strategy that is most effective for one of the types, then it is essential to identify what type of stock it is.
Drum roll please.
The three types of stocks are……Trending up, Trending down, and sideways. Yep. But as simple as it is, how do we find stocks that belong in these three categories?
The answer is through the use of screeners. You would think that every screener could do this basic analysis, but not so. And controlling the time range for the analysis is very important since stocks work their way from one type to the other.
I couldn’t figure out how to screen for the different types with the Yahoo Finance screener. Maybe there is a way, but in any case, I resorted to the thinkorswim platform.
To find positive trending stocks, set up a study in the thinkorswim platform in the following way:
I set the price change to 10 percent, so that the scanner looks for stocks that have exceeded 10 percent gain in price 125 bars ago. The bars term is a reserved word, which means, in this case, 125 trading days, which is about when the bottom of the Corona Crash happened for the time of this blog. The D on the right is what defines what the bar is. You can set it to months or as little as 1 minute.
Unfortunately, there are only 23 months of historical data that the study can use. The study feature in thinkorswim is very powerful, with many bells and whistles. You can customize it by adding more indicators, adjusting selection menus, or using the scripting language that comes with the tool.
To find Negative trending stocks, set up a study in the thinkorswim platform in the following way:
To find the sideways stocks set the study up like this:
The strategies for each category, in most cases, are different. The screener presented may need more refinement to be effective with a particular trading strategy. For example, if you are interested in investing in oscillator stocks, ones that are sideway stocks but oscillate from low to high often, then the screener would have to be modified to detect the number of crossings through a range.
For trend trading, you might add average indicators to the screener.
In any case, the screener mentioned is a start to finding which stocks belong to the trending up, down, and sideways categories. It is up to the reader to narrow down the list of stocks it provides to find a stock that meets the trading strategy.
I highly recommend TD Ameritrade and would like to refer you to them. To find out why I think they are so good click on the Ameritrade referral link.
Also, if you’re interested in learning about the differences and similarities in strategies of the best of the best traders, investors, and hedge fund managers check out my book Stock Market Masters.
A friend of mine, with the trading alias of the Lone Ranger, told me that her relative said investing in Penny Stocks is Gambling.
By definition, Gambling is the activity or practice of playing a game of chance for money or other stakes.
The sentiment that investing in the stock market is Gambling is often expressed by people who believe that making money by purchasing stocks is unlikely. The result for most people will be a loss.
The points above are reflected in the paper titled, “Who Gambles in the Stock Market?” by Alok Kumar.[1] In the paper, Kumar identifies lottery-type stocks by using lottery tickets as a reference. Lottery tickets have very low prices relative to a high potential payoff. They have a minuscule probability of a huge reward and a huge chance of a small loss.
To identify lottery-type stocks, Kumar organized stocks with low prices, high volatility, and investor sentiment skewness into the stocks with lottery-like features category. In other words, there may be high volatility of oil company security due to pipeline breaks. This may result in an adverse price move. Conversely, if a large oil field is discovered, this may cause a positive price move. The result is the high volatility of the stock price.
When these events happen for a particular company more than once, there may be a skewed perception of the company unrelated to the company’s fundamentals. People may invest in them thinking that the large moves will happen again, especially if it’s a low priced stock, AKA Penny Stock.
Kumar concludes that the characteristics of lo lottery-type stocks are that they have low market capitalization of 31 million or below, low institutional ownership at 7.35% or below, and lower liquidity. These stocks are young, have low analyst coverage, significantly higher volatility, skewness, and low price per share.
Remember the sentiment we discussed earlier?
According to the Tradeciety website:
“Profitable day traders make up a small proportion of all traders – 1.6% in the average year.”[2]
That doesn’t sound encouraging, but my experience indicates that this may be a problem with trading frequently. Many famous investors have made money through the long term buy and hold investing, such as Warren Buffett, Jack Bogle, John Templeton, Peter Lynch, and Benjamin Graham.
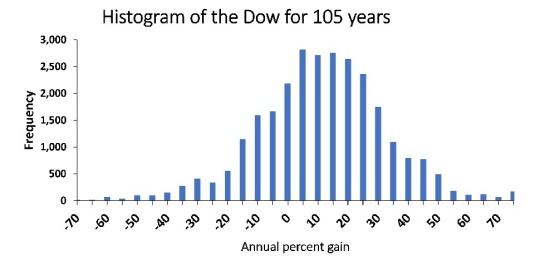
I have found that the market has something going for it that favors long term investing. This may end someday, but historically the market goes up over time and always recovers from a crash. In my book Crash Proof Your Investment, I developed a historical histogram chart that shows favoritism to profitable return.
The graph shows that the market has positive returns more frequently because the bulk of the graph’s bars are above 0 percent annual return. The market is skewed! Five percent, ten percent, and fifteen percent annual returns are the most frequent.
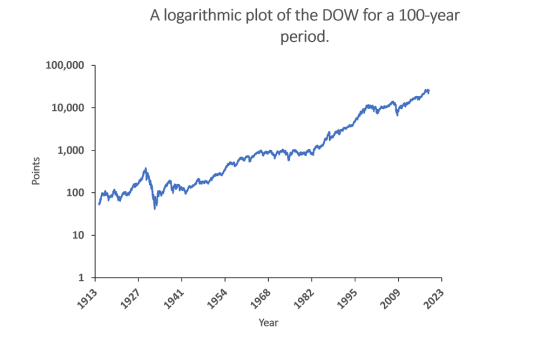
A more familiar chart is the one shown below:
The trend over 100 years is undoubtedly up. The most significant disturbance in the trend is the crash of 1929. It was the most disastrous crash in American history, accounting for its aftereffects—a 12-year Great Depression followed, which affected most of the world.
Despite the 89 percent decline, in the long run, the stock market recovered.
Finally, from the paper by Kumar, four-factor models for the stock market return are mentioned. Investopedia explains that the results of the Fama and French Three-Factor Model and states that:
“Fama and French highlighted that investors must be able to ride out the extra short-term volatility and periodic underperformance that could occur in a short time. Investors with a long-term time horizon of 15 years or more will be rewarded for losses suffered in the short term. Using thousands of random stock portfolios, Fama and French conducted studies to test their model and found that when size and value factors are combined with the beta factor, they could then explain as much as 95% of the return in a diversified stock portfolio.”[3]
So as you can see from the Investopedia article and the work of Fama and French (Nobel laureates), long term investing offsets short term losses that a day trader or short term trader might experience.
In the book Intelligent investor, which is one of the seeds of Warren Buffett’s massive fortune, there is commentary from Zweig’s section that says
“Like casino gambling or betting on the horses, speculating in the market can be exciting or even rewarding (if you happen to get really lucky). But it’s the worst imaginable way to build your wealth. That’s because Wall Street, like Las Vegas or the racetrack, has calibrated the odds so that the house always prevails, in the end, against everyone who tries to beat the house at its own speculative game.
On the other hand, investing is a kind of a unique kind of casino—one where you cannot lose in the end, so long as you play only by the rules that put the odds squarely in your favor. People who invest make money for themselves; people who speculate make money for their brokers. And that, in turn, is why Wall Street perennially downplays the durable virtues of investing and hypes the gaudy appeal of speculation.”[4]
In summary, we have discovered that there are lottery-type stocks that resemble Gambling and there are investing strategies where the outcome is more likely to be profitable. So investing in the stock market is not Gambling—keyword investing. But there are plenty of opportunities to gamble with securities in the stock market. These tend to be, but are not limited to, penny stocks.
That’s all for now; good luck with your financial goals,
[1]Kumar, Alok. “Who Gambles in the Stock Market?” The Journal of Finance 64, no. 4 (2009): 1889-933. Accessed September 14, 2020. http://www.jstor.org/stable/27735154.
Kumar, Alok. “Who Gambles in the Stock Market?” The Journal of Finance 64, no. 4 (2009): 1889-933. Accessed September 14, 2020. http://www.jstor.org/stable/27735154
Commission-free trades are the norm for trading platforms these days. But not all trading platforms are created equal. I like TD Ameritrade. It has the best tools, customer service, and I have been with them for 15 years and had no issues. If you are seeking the best tools and customer service for non-penny stock investing, then I recommend them and would like to refer you through the following link where we could both earn a small cash reward:
But in the case of penny stocks, Ameritrade is not the best platform to use. They charge $6.95 for OTCBB (Over the Counter Bulletin Board) trades.
Besides Ameritrade, I considered four other platforms. They are TradeStation, Robinhood, Bank of America’s Merrill, and Charles Schwab. For me, the winner is Charles Schwab. But let’s discuss the drawbacks I saw for the others before we discuss Charles Schwab.
To start, TradeStation is considered one of the best brokers for penny stocks in a few online articles. But I had issues when signing up for an account. First, the way to fund the investment account has changed for most stockbroker sites. Most brokers will present the customer with a pop up where you enter your bank account password to put money in your investing account. The problem is I’m uncomfortable with putting my bank password in other websites. It feels like a security issue. On TradeStation, the pop up came up, and in the address bar, it still said the browser was on the TradeStation website. I typed in the password, “you must be joking.” It’s not a real password, and I can’t fund my account with it. In any case, there is the traditional ACH option through a pdf form you fill out, and email in.
The trading tool is limited compared to the thinkorswim trading tool on Ameritrade and doesn’t hold a candle to it. If you look at the BBB rating for the company, it is perfect, but 1-star reviews detail the issues of the TradeStation platform. There is not much-supporting information on the website to help with stock investment research, either. Trades are free up to 10,000 shares, $0.005 per share for each share above 10,000. Only limit orders are allowed for OTC markets. Finally, the COVID-19 pandemic has made contacting them difficult and slow.
Robinhood has a neat referral program where an account holder can give their link to a friend, and if they sign up, the account holder gets one share of a random stock. Very cool! However, my friend referred me, and he never got his one share. Maybe there are account requirements that I don’t meet. I never funded the account, so I don’t blame Robinhood for not giving my friend a share. In any case, COVID-19 again interferes with communication, but I emailed them and got a quick response. The funding option is through a password requesting pop up. There is a trick for not using that. Type in Sherwood Forrest for the bank (a fake bank name), and an option to link the bank will come up manually. This takes you to an online ACH method.
The trading tool looks very basic, and I don’t see much in terms of help for stock investment research. Penny Stock trades are commission-free, however.
Merrill is a possibility with its commission-free trades. They, too, presented me with pop up requesting a password to my bank account. But I was able to get the form for ACH, which could be emailed. Merrill requires that penny stock trades are limit orders. If the volume is high enough, a trader may want to use a market order. So this limitation ruled them out. I also remember having difficulty determining which stocks I could invest in and which I could not on Merrill, as some are not available through them. I remember putting in a lot of time researching a stock only to find out it was not available for trading through their trading tool. There may be a way to tell what is available to invest in, but the rep I talked to didn’t know what it was. At least they were willing to speak to me on the phone despite the COVID-19 shortages.
And finally, we come to Charles Schwab. Charles Schwab has commission-free penny stock trades. They do present the customer with the pop-up window asking for the bank account password, but they have an online ACH method that is evident and easy to find. Finally, I could chat online with a knowledgeable rep at a moment’s notice during the weekend. The responses were quick.
The trading platform seems fine, and they have a lot of information and tools to help research stocks. I also like their referral program. If I refer you and you deposit at least $1000, you get a $100 reward.
Based on my platform considerations above, I selected Charles Schwab for penny stock trading and am referring my readers to Schwab through the following link:
In my last blog, Is Investing in the Stock Market Gambling? I found that some penny stocks have lottery features, and purchasing them may be considered gambling. The characteristics of a lottery-type stock were identified, and one of the features is low liquidity, or low buy/sell volume which is a red flag that purchasing the equity may be gambling.
Does the fact that a penny stock has lottery-type features mean that you should not purchase them? I think it depends on the investor and his or her goals. But, understanding if a penny stock has lottery-type features or not is essential to becoming in tune with the reality of the situation.
In my book Stock Market Masters, I point out that phenomenal investors such as Warren Buffett are in tune with the reality of an investing situation and acknowledge it. The great investor’s reaction to the truth is what sets them apart from the average investor. Their trading or investing moves are based on their accurate understanding of reality which makes them incredible amounts of money and puts them in the legend category.
If you find that a penny stock has lottery-type features, what will your move be? I can think of ways to make money, whether it does or does not have lottery-type features. There are ways to exploit the reality to your advantage. It is up to the reader to figure out what those are.
This blog will focus on using a screener to find penny stocks that have low and high liquidity. The screener I will use is the free Yahoo Finance screener. But remember that the equities found in the screener may not be available on the trading platform you use. For example, in my discussion with a Meryl Lynch representative, I discovered that not all penny stocks are available. Because of the liquidity issue with some Penny Stocks being low, Meryl Lynch requires that all orders be limit orders for Penny Stocks. A limit order guarantees a trade at a specific price; otherwise, the trade is not executed and protects the buy and sell order from achieving an unrealistic price.
A ridiculous price for a transaction may happen if someone wants to unload 1000 shares of penny stocks purchased at 2 dollars per share with a market order, and there is low buy sell volume. If there are few buyers, then the price of the sale could be very low. Maybe 5 cents per share. If the transaction occurs, then the $2000 purchase becomes a $50 sale. Ouch!
Low volume burned many people who had stop-loss orders in the Flash Crash of 2010. I write about the Flash Crash and the issues with stop-loss orders in my book Crash Proof Your Investment.
To find the penny stocks that have low volume go to the Yahoo Finance screener at the following link:
Next click the create screener button and set up the filters as shown in the figure below:
The filters are
Region = United States,
Average Volume for 3 Months is less than 1000,
Price is less than $5,
Sector is Technology
Market Cap is less than 31 Million dollars
Clicking the find stock button yields 52 equities to consider. From the list, I looked up the company Duo World Inc with ticker symbol DUUO. The wide bid-ask spread indicates the low liquidity of the stock.
A buyer is willing to buy 100 for $2, and a seller is willing to pay $28 for 100. The spread is 1300 percent of the lower stock price. [ (($28-$2)/$2)*100 percent ]. This illustrates why limit orders that guarantee a specific sale price are important to use in this case.
To find the penny stocks that have high volume, set the screener up as shown below:
The filters are
Region = United States,
Average Volume for 3 Months is greater than 1000000,
Price is less than $5,
Sector is Technology
Market Cap is less than 31 Million dollars
Clicking the find stock button yields 52 equities to consider. From the list, I looked up the company Cemtrex Inc with a ticker symbol CETX. The wide bid-ask spread indicates the low liquidity of the stock.
A buyer is willing to buy 100 for $102, and a seller is willing to pay $105 for 100. The spread is 3 percent of the lower stock price. [ (($105-$102)/$102)*100 percent ]. In this case, using the market order is less likely to end up with a price for the transaction that is unfair.
In summary, I presented the Yahoo Finance screener to look for penny stocks with high and low buy/sell volume. Understanding the reality of your equities is very important, so you can react well to the reality and increase your odds for success.
Now and then, I hear someone say that stock market investing is gambling. Is this true or false?
A good friend of mine, with the stock trading alias of the Lone Ranger, told me that her relative said investing in Penny Stocks is gambling.
Gambling is, by definition, the activity or practice of playing a game of chance for money or other stakes.
Let’s take a step back, this implication, that investing in the stock market is gambling, is often a sentiment expressed by people who believe that making money is not likely. The result for most people will be a loss. Furthermore, there may be little basis for a sound investment in some stocks, such as penny stocks, since investing theory indicates that a company’s financials may not be in line with a sound business model.
The points above are somewhat reflected in the paper titled, “Who Gambles in the Stock Market?” by Alok Kumar.[1]
In the paper, Kumar identifies lottery-type stocks by using lottery tickets (the most common form of gambling) as a reference. Lottery tickets have very low prices relative to a high potential payoff. They have low negative expected returns, and the prize distribution has exceptionally high variance. Most importantly, they have a minuscule probability of a huge reward and a huge chance of a small loss.
To identify lottery-type stocks, Kumar characterizes stocks with low prices, high volatility, and investor sentiment skewness. The author has more precise terms that many people have never seen before.
For example, he uses the term idiosyncratic volatility where Investopedia defines idiosyncratic risk in the following way:
“Idiosyncratic risk refers to the inherent factors that can negatively impact individual securities or a very specific group of assets. The opposite of Idiosyncratic risk is a systematic risk, which refers to broader trends that impact the overall financial system or a very broad market.”[2]
In other words, there may be high volatility of oil company security due to pipeline breaks. This may result in an adverse price move. Conversely, if a large oil field is discovered, this may cause a positive price move. The result is the high volatility of the stock price. When these events happen for a particular company more than once, there may be a skewed perception of the company unrelated to the company’s fundamentals. People may invest in them thinking that the large moves will happen again, especially if it’s a low priced stock, AKA Penny Stock.
Interestingly enough, Kumar’s paper does have a table that characterizes lottery-type stocks. Table 2, titled Basic Characteristics Of Lottery-Type Stocks, reports that there are 1500 lottery-type stocks, 1500 non-lottery-type stocks, and 9000 stocks in the middle.
So what are the characteristics of a lottery-type stock?
The table reports that the firm size average is very low with an average market capitalization of 31 million, low institutional ownership at 7.35%, a relatively high book to market ratio 0.681, and lower liquidity. These stocks are also younger, with a mean age of about six years. They have low analyst coverage, most don’t have dividends, they have significantly higher volatility, higher skewness, and lower prices.
The author goes on to report that lottery-type stocks are concentrated heavily in the energy, mining, financial services, biotechnology, and technology sectors and the lowest concentration of lottery stocks is in the utilities, consumer goods, and restaurant sectors.
Given the fact that there are lottery-type stocks and non-lottery-type stocks, how likely, in general, is a trader or investor to make money in the Stock market? Remember the sentiment we discussed earlier, that most people lose money in the stock market, which is similar to the feature of lottery tickets with their negative expected return.
According to the Tradeciety:
“Profitable day traders make up a small proportion of all traders – 1.6% in the average year. However, these day traders are very active – accounting for 12% of all day trading activity.”[3]
That doesn’t sound encouraging, but this may be a problem with trading frequently.
What about the long term, buy and hold investing as Warren Buffett does? His favorite holding period is forever.[4]
I made the most money in the stock market in paper gains when I picked outstanding diversified funds, ignored them when the market was misbehaving, and held them long term. Many famous investors have made money through the buy and hold strategy, such as Warren Buffett, Jack Bogle, John Templeton, Peter Lynch, and Benjamin Graham.
In my opinion, market fluctuations are unpredictable most of the time. Sometimes you can see the writing on the wall; for example, the Corona crash seemed evident in my opinion. The virus itself was a surprise, though, and so was the financial crash of 2008.
The market has something going for it that favors long term investing. This may end someday, but historically the market goes up over time and always recovers from a crash. (We are almost out of the Corona Crash with the S&P and NASDAQ making new highs. We are waiting on the DOW which is close). In my book Crash Proof Your Investment, I developed a historical histogram chart that shows this favoritism.
The vertical axis may look confusing. What does it mean?
I calculated the rolling annualized returns by using one year of data. But the annual return is calculated for each market day, so the one year of data slides like a window to collect a new day and dispense of an old one. There were 251 trading days in 2018, which means there are 251 annual return values.
Over 105 years, there are about 26,355 (251 x 105 = 26,355) annual return values.
The horizontal axis depicts the annual percentage gain. By looking at the 0 percent annual bar, you can see that 0 percent annual return happened a little less than 3,000 times in 105 years.
Disappointing returns for the long investor!
More importantly, the graph shows that the market has positive returns more frequently because the bulk of the bars in the graph are above 0 percent annual return.
The market is skewed! Five percent, ten percent, and fifteen percent annual returns are the most frequent.
There are even some outliers at a 70 percent annual return and above.
To put these numbers in perspective, let’s answer the question: How long will it take an investment to double in the market?
The average return was 9 percent? If we assume that is the fixed rate of return for every year that the investment is in the market, then we can use the Rule of 72 to answer the question.
The Rule of 72 is an equation that provides you with the length of time an investment will take to double. In our case we would divide 72 by our fixed rate of 9.
Our answer shows us it will double every eight years. Impressive!
If the graph is still confusing, there is still hope. Check out the excellent article on Investopedia called “Rolling Return.”[5]
A more familiar chart is the one shown below:
The trend is undoubtedly up. So this indicates that there may be something to buy and hold for the long term.
Finally, from the paper by Kumar, four-factor models for the stock market return are mentioned. A somewhat simplified explanation of this model is in the Investopedia article titled, Fama and French Three-Factor Model[6]. The article states that:
“Nobel Laureate Eugene Fama and researcher Kenneth French, former professors at the University of Chicago Booth School of Business, attempted to better measure market returns and, through research, found that value stocks outperform growth stocks. Similarly, small-cap stocks tend to outperform large-cap stocks. As an evaluation tool, the performance of portfolios with a large number of small-cap or value stocks would be lower than the CAPM result, as the Three-Factor Model adjusts downward for observed small-cap and value stock out-performance.”[7]
Later on the article reports:
“Fama and French highlighted that investors must be able to ride out the extra short-term volatility and periodic underperformance that could occur in a short time. Investors with a long-term time horizon of 15 years or more will be rewarded for losses suffered in the short term. Using thousands of random stock portfolios, Fama and French conducted studies to test their model and found that when size and value factors are combined with the beta factor, they could then explain as much as 95% of the return in a diversified stock portfolio.”[8]
So as you can see from the Investopedia article and the work of Fama and French, long term investing offsets short term losses that a day trader or short term trader might experience.
In the book Intelligent investor, which is one of the seeds of Warren Buffett’s massive fortune, there is commentary from Zweig’s section that says
“Like casino gambling or betting on the horses, speculating in the market can be exciting or even rewarding (if you happen to get really lucky). But it’s the worst imaginable way to build your wealth. That’s because Wall Street, like Las Vegas or the racetrack, has calibrated the odds so that the house always prevails, in the end, against everyone who tries to beat the house at its own speculative game.
On the other hand, investing is a kind of a unique kind of casino—one where you cannot lose in the end, so long as you play only by the rules that put the odds squarely in your favor. People who invest make money for themselves; people who speculate make money for their brokers. And that, in turn, is why Wall Street perennially downplays the durable virtues of investing and hypes the gaudy appeal of speculation.”[9]
In summary, we have discovered that there are lottery-type stocks that resemble gambling in the stock market and there are investing strategies where the outcome is more likely to be profitable. So investing in the stock market is not gambling—keyword investing. But there are plenty of opportunities to gamble with securities in the stock market. These tend to be, but are not limited to, penny stocks.
That’s all for now; good luck with your financial goals,
[1]Kumar, Alok. “Who Gambles in the Stock Market?” The Journal of Finance 64, no. 4 (2009): 1889-933. Accessed September 14, 2020. http://www.jstor.org/stable/27735154.
Kumar, Alok. “Who Gambles in the Stock Market?” The Journal of Finance 64, no. 4 (2009): 1889-933. Accessed September 14, 2020. http://www.jstor.org/stable/27735154
Well, I’ve found myself with too much to do once again. I have a habit of doing that. Many things look fun and exciting to me, and not long after I think about them, I find myself spending time on them. What to do?
I have read the book, The 7 Habits Of Highly Effective People, and it mentions getting rid of all things that are time wasters that don’t contribute to your goals. This is habit 3 from the book, put first things first. The book separates your activities into four quadrants, which are categorized below with an example activity:[1]
Quadrants of the Time Management Matrix
Important and urgent
Deadline driven projects
Important and not urgent
Planning and Recreation
Not important but urgent
Interruptions and some calls
Not important and not urgent
Trivia and busywork
Highly effective people spend more time in the important and not urgent quadrant as it is proactive and keeps them out of crisis mode.
Another way to tackle the problem is in the famous story regarding Warren Buffett’s pilot Mike Flint. In the story, Warren asks the pilot the following question. What are your top 25 career goals? And Warren Buffett suggests he write them down on a piece of paper.[2]
After doing so, Mike Flint was to circle the top five. Mike then said he would concentrate on the top five but work on the others intermittently since they were reasonable goals. But Warren Buffett said, “No. You’ve got it wrong, Mike. Everything you didn’t circle just became your Avoid-At-All-Cost list. No matter what, these things get no attention from you until you’ve succeeded with your top 5.”
And so there you have it straight from one of the world’s most successful investors. Work on your top five goals. You can, of course, use Stephen Covey’s quadrants to help you understand how important and urgent these goals are, and that may move the goal up or down in your top 25 goal list.
In Stock Market Masters, my book about the habits of phenomenal investors, I call this habit Laser Focus on your investment goals, and all three of the great investors mentioned in the book are passionate about this habit.
In any case, I hope that helps with your busy life,
Today I mitigated some risk in my corona crash investments.
Near the bottom of the crash, I invested in AZO, SBUX, AAPL, WFC, XOM, and BA. I sold AZO, SBUX, and AAPL with a 30, 33, and 25 percent gain, respectively.
What did I do with these gains? I reinvested them in WFC, XOM, and BA. The reinvestment helped lower my cost basis since these stocks are losers in my portfolio. I reinvested in them because I was optimistic that they would come back to their former glory.
But I have been reading recently, and I see troubling fundamental problems involving trends and financial strength ratios. For the upcoming discussion, the following definitions from the TD Ameritrade website are useful:[1]
The Quick Ratio:
“Current assets minus inventories divided by current liabilities. The Quick Ratio measures a company’s ability to meet its short-term obligations with its most liquid assets. The higher the Quick Ratio, the better the company’s short-term financial strength.”
Total Debt / Total Capital:
“This is the debt divided by shareholder’s equity plus debt in a company’s most recent quarter. A higher ratio may mean that the cost of debt could weaken a company and increase its default risk.”
Interest coverage ratio:
“Ratio of earnings before interest and taxes for the trailing twelve months divided by the trailing twelve-month interest expense. A ratio below 1 means the company is not generating sufficient revenue to meet its interest obligations. Used to determine how easily a company can meet interest payments required on its debt. NOTE: This item is not meaningful for banks and insurance companies.”
These ratios are found by typing in the stock symbol in the search box, then clicking on the valuation tab, and then the financial strength link. How convenient!
BA–Boeing:
Boeing started with the 737-8 Max problem before the pandemic resulting in a grounded airplane. The grounded plane was a big financial hit and drove the stock price down. Then along came the COVID pandemic, which punished commercial aviation, causing a 90 percent decline.
A boost in commercial aviation is likely to happen when a vaccine comes out. When the 737-8 Max is allowed to fly, it will help Boeing as well. These events are likely to occur within a year or two. However, the work from home and stay local movement will linger and have a lasting impact, and I believe this means an even slower recovery for commercial aviation demand.
How long can Boeing survive with all this going on? I think the government will not let the company go under as it is one of America’s jewels. There is supposed to be money for it in one of those stimulus bills.
The ratios below help determine the financial strength of the company:
“BA has a Debt to Total Capital ratio of 122.77% and is among the most highly leveraged companies in the Aerospace & Defense industry. The company could face trouble servicing its debt as both its Interest Coverage and Quick ratios show that neither operating profits nor current assets alone are great enough to satisfy interest obligations.”
The premise going into this investment was the pandemic is temporary, and the recovery will take care of the shortfall. But when a company has a financial issue within a year, and the pandemic improvement for BA is one to two years, then my premise has problems.
XOM–Exxon Mobile:
In this case, less driving has led to a glut in the supply of oil and a price reduction. There have been moves to reduce the oil supply by the key players. But there is the work from home and stay local movement that will hamper demand for a long time. Additionally, there are disruptive technologies like electric cars, solar power, and wind farms that are a threat to the bottom line of oil-producing companies. Plastics will keep the oil industry afloat for sure. But it seems it will be a long time before demand comes back if it ever does.
Will XOM survive? I haven’t heard of any backup measures to rescue this company.
The ratios below help determine the financial strength of the company:
“XOM’s debt to total capital ratio, at 27.08%, is in-line with the Oil, Gas & Consumable Fuels industry’s norm despite its increase over the last year. The company could face trouble servicing its debt as both its Interest Coverage and Quick ratios show that neither operating profits nor current assets alone are great enough to satisfy interest obligations.
The premise going into this investment was the pandemic is temporary, and the recovery will take care of the shortfall. But when a company has a financial issue within a year, and the pandemic improvement for XOM is one to two years, then my premise has problems.
WFC–Wells Fargo:
Wells Fargo started with a checking and savings account scandal that led to fines. Additionally, the real estate market may turn over in the future due to record unemployment and the difficulty of making the rent or mortgage payment. There are programs to defer the mortgage payments, but in the end, the bill still has to be paid. The delay in the rent payment puts stress on landlords, and if there is not a program to catch them, some will have the risk of default due to the use of leverage and thin margins in their investment business. The loan defaults will hurt WFC’s financial picture because of their exposure to real estate loans. Additionally, the FED has reduced the interest rate, and this reduces the profit the banks can make.
However, WFC is a bank that is too big to fail, so there is a strong possibility it will get a rescue package.
Is WFC financially secure? A stress test can help determine that. The FED requires this for banks labeled too big to fail.[4] From the most recent stress test, WFC is above the minimum standards. One outcome of the stress test, however, is that WFC had to lower the dividend.
Overall, I think the industries discussed will recover, except I have some doubts about the oil industry due to the disruptive technology. At this point, the COVID reaction of the world has lasted longer than I expected. My original reason for investing in these stocks was that the recovery would be quick. It is proving to be quick because the S&P and NASDAQ have gone to new highs, and the DOW is not far behind. But BA, XOM, and WFC are lagging and still significantly down from their highs.
How long can the companies withstand this? For me, at this point, it is wise for me to invest in representative ETFs to add more diversification to the mix. Diversification minimizes the blow if one of the companies in my portfolio fails. It is more conservative.
To this end, I sold BA and XOM and divided the funds up into ITA (Aerospace ETF) and WFC. The main points here are that I believe is that the recovery for these stocks is taking longer than I expected and increasing the risk for bankruptcy. The industries will eventually come back. WFC has the too big to fail status and is OK based on the last stress test. Finally, the sale of losing positions helps me offset the capital gains from my three winners. The sale will help reduce my taxes.
In my book Crash Proof Your Investment, one protection method is to sell the position for a reason other than Price. In this case, I have found that my original reason for buying the stock does not seem to be valid anymore.
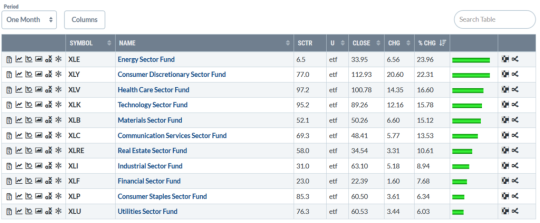
Sector rotation is an investment strategy based on the reality that some sectors will perform better than others but then will fall out of favor in the business cycle. Managers will buy sectors that are about to come into favor and sell them when the sector’s performance peaks. The following is a list of sectors and the ETFs that track them:
XLE Energy Sector
XLY Consumer Discretionary
XLV Health Care
XLK Technology
XLB Materials
XLC Communications Services
XLRE Real Estate
XLI Industrial
XLF Financial
XLP Consumer Staples
XLU Utilities
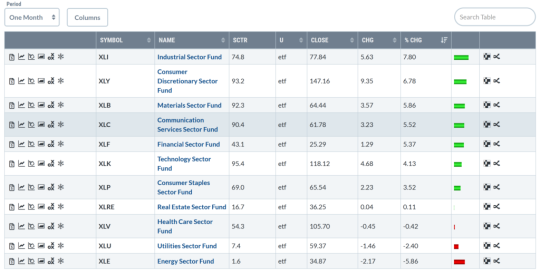
Twenty-four days after the bottom of the Corona crash, I captured a snapshot of the performance of the sectors.
On 9/8/2020, the snapshot is below:
The energy sector has gone from the top spot to the bottom spot. But why and what is the outlook for the sector?
According to the Charles Schwab website, there is a massive supply/demand imbalance in oil from the economic downturn due to COVID. But oil production has been slashed for months now, and as the economy reopens, the demand should stabilize. The speed of the recovery of the economy is uncertain, however.
Many articles discuss the cut in oil production. In May and June, OPEC and its allies agreed to cut oil production by 9.7 million barrels a day.[1] In August, the cuts eased by 1 million barrels per day.[2] Additionally, Saudi Arabia has ended its cuts according to the IEA website in an article titled Oil Market Report – August 2020.[3] So although there were cuts in oil production from key players, there is now a movement to relax restrictions.
But what about the oil demand? From what I have read, the recovery for the need for oil is slow. According to the World Oil website, the recovery will take to at least 2022 [4] , and the oil price website indicates that the demand in 2020 will drop 9.1 million barrels per day.[5]
For the demand for oil to increase, the economy has to recover so that people start driving more and buying more products that use oil to make them (i.e., plastics).
The good news is the unemployment rate has decreased from its low of 14.7 percent[6] to 8.4 percent in August[7]. With more people working, there should be more driving, and people should be buying more petroleum-based products. But, the movement to work from home reduces the use of oil because people will drive and fly less. However, there is a limit to how many people can do from home because only 40 percent of jobs can be work from home jobs.[8] Additional pressures on the oil demand are wind farms, solar plants, and electric cars.
The largest driver for demand in oil is becoming plastics:[9]
“Petrochemicals, which make up 99% of all plastics, are the versatile building blocks of modern life. Derived from petroleum and fossil gas, they are found in clothes, paper, fertilizers and cleaning products — and even food preservatives and medicine.
Petrochemicals are rapidly becoming the largest driver of global oil consumption, a report by the International Energy Agency found in 2018. They are set to account for a third of the growth in demand to 2030 and half of the growth to 2050, ahead of trucks, planes and ships.”
So the reduction in demand and glut in the supply of oil due to the COVID crisis is the main driver for the low performing energy sector. The economy is improving, which will increase demand, but there are trends and disruptive forces that are contrary to demand oil.
On the TD Ameritrade website, I have access to analysts’ opinions on the energy sector ETF XLE. 3 Analysts rate the ETF as an avoid or sell. But for the company Exxon Mobile which is a stock I bought in the crash, the ratings are mostly neutral or hold. However, there is a 48 billion shortfall for the company, and the company may have to restructure.
That’s all for now. If you need some interesting financial books to read that will help you with your financial goals check out my books below.
Today I am writing about penny stocks. A penny stock is any security that trades under $5.00 per share.
I have a stock in my portfolio that qualifies as a penny stock, but it didn’t start as one. This stock ticker symbol is TNGNQ. They were in the business of figuring out how to make bladders with 3D printers. Long story short, I invested about $2000 at about 30 dollars per share in 2011, and now it is sitting at three cents a share. My only 100 percent loss!
Currently, companies have successfully printed bladders, as illustrated in the article on the 3dprinting website titled Bladder grown from 3D bioprinted tissue continues to function after 14 years.[1]
So what happened?
When I invested in TNGNQ, I looked at the balance sheet and saw that the company doesn’t work out financially. They were operating at a loss, and they had just acquired 10 million dollars from a public offering. I could tell it all was not going to work out. But I invested in it anyway. I liked the idea of 3D printing of bladders. If it worked out, it would solve a huge problem for the organ shortage in the world. But the financial numbers said the company was not going to be around for long.
And so now it is at three cents a share. I will never get rid of the stock. It is my reminder of what I did and to not do it again.
But today, I am writing about penny stocks with the hopes of getting my friends together in a group to invest in penny stocks. It’s not a competition but more of a learning experience.
The investing fun is also the perfect opportunity for me to try a trading idea I came up with when writing my book Stock Market Masters. Long story short, I did some stock market modeling and uncovered something amazing, but I did not believe the results because if true, I would own a small country in about a year. I deleted it from the book. I reasoned that there must be something wrong with my models and analysis. A model in the ThinkOrSwim platform said it was wrong. But another model I worked with showed promise.
Anyway, I’m going to try it on penny stocks.
When investigating penny stocks today, I found the warrior trading website ranking high on my google search for penny stocks. Ross, the author of the page, made a million dollars in two years trading penny stocks.[2]
“Trading Penny Stocks turned me into a self-made millionaire. In January 2017, I decided to start over. I began with $583 in my account, and as of May 2019, I broke the $1 million mark in profits!”
The site later on points out that only 10 percent make money trading penny stocks, “at the end of the day, only 10% of active traders in the market will be profitable.”[3]
And so there you go. The 2 million dollars in 2 years is a result that is not typical.
The site has a penny stock trading guide for beginners.[4] According to the website, there are four tiers of penny stocks.
Tier 1: stocks are those between 5 dollars and 99 cents. Thes stocks trade in increments of a penny and are on the NASDAQ and NYSE.
Tier 2: stocks are those between 1 cent and 99 cents. These stocks trade at fractions of a penny.
Tier 3: stocks are below 1 cent a share. TNGNQ is in this tier.
Tier 4: Tripple zero stocks are from 0.0001 to 0.0009 dollars.
Ross discusses a strategy for picking the penny stocks on the site as well, and he has screeners to help him identify which ones to choose. The site is, of course, selling a product, but I will not be buying it since I have my strategy to try.